

Icograms: Exploring how Quebec changed between 1905 and 1980
Students
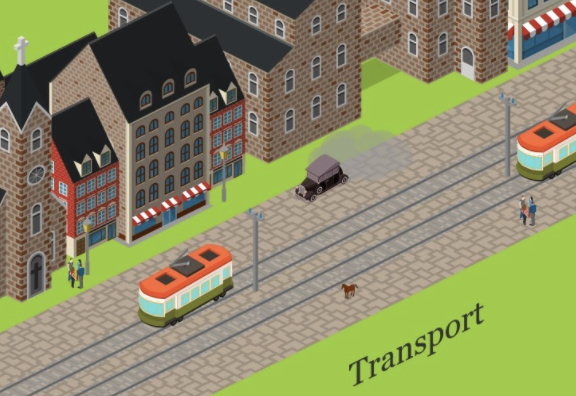
Creating a map can be a good way to show what you know about a specific place and time period. Icograms is free software that allows you to create your own 3D maps. Here is a guide to help you learn how to use Icograms.
In this student booklet, you will explore how the dominant society in Quebec changed between 1905 and 1980 and create your own 3D map. Why not base your map on your own community or another city that is close to you? You could find out more about your town by interviewing people from your community or looking at photos.
Teachers
Here is a student booklet to nurture competency 2. It was originally created by RÉCITUS. Students will research Quebec society around 1905 and 1980 and explore how different aspects changed over time. Then they will create a 3D map of a place in Quebec around 1980 using Icograms software.
We’ve created this accompanying Teacher’s Guide to help with planning and assessment. We’ve also translated this guide to using Icograms (originally created by RÉCITUS).
Why not take a local spin on this project? Students could research and create models of their own town or another nearby location around 1980? Here is a guide to local history that may be of use.
Going Further:
You may want to encourage students to reflect on how different aspects have continued to change since 1980. How do your students think societies and territories will continue to evolve? Students could even create a map predicting what their community might look like 40-50 years from now!